Property Portal - Power BI Reports
 This article is part of the Property Portal section.
The images below are for demonstration purposes only and do not contain real data.
Viewing and Filtering Reports
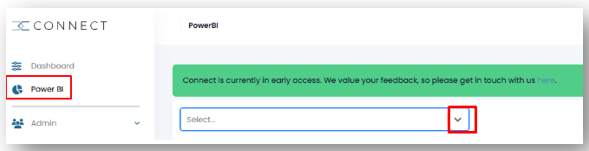
Property Portal includes a Power BI integration, allowing us to share key reports with you. You can access them from the Power BI menu on the left.
The available reports appear in the drop-down menu:
- The upper section displays data using bar charts and pie charts:
- The lower section presents the same data in table format. This area may include multiple tabs, selectable at the bottom.
- Click a column header to sort the data.
- Click again to reverse the sort order:
- Click an item in the chart or table (e.g. a Property Manager name) to filter the view:
- Click the same item again to remove the filter and show all data.
Using the Filter Pane
- The Filter Pane is located on the right-hand side of the screen.
- Not all reports include filters — if available, you can reveal them by clicking the double arrows:
- Click into a blank area of a chart or a tab at the bottom of a table to refresh the view and check for filters related to that section:
- If there are many available filters and you are looking for a specific one, type in part of the name of that filter in the top Search box to locate it:
- To use a filter, click the downward arrow and either search or select an option from the list:
- To clear a filter, click the eraser icon:
More Options - Hovering Over Visuals
- Hover over a visual (such as a chart or table) to reveal additional options in its top right corner:
- The filter icon highlights when filters are in use and shows which ones have been applied on the right-hand side:
- The focus mode icon lets you expand the chart or table for a closer view:
- Click Back to report to return to the full view:
- Click the More Options icon (three dots) to see options such as::
- Export data (for more, see the Exporting a Report section),
- Show as a table: display the visual in table format
- Spotlight: highlight this visual by dimming others
- Sort axis/legend: choose what to sort by and sort order
Options may vary depending on the visual.
Exporting a Report
You can export data by clicking the More Options icon (three dots) on the visual you want to export:
- Click the three dots and select Export data.
- Choose a File format: Excel (.xlsx) or CSV (.csv).
- Click Export:
More Options - Right-Clicking on Items within Visuals
- Right-click on a chart item to see more options:
- Show data point as table: View the selected item in table format.
- Show as a table: View the whole visual in table format.
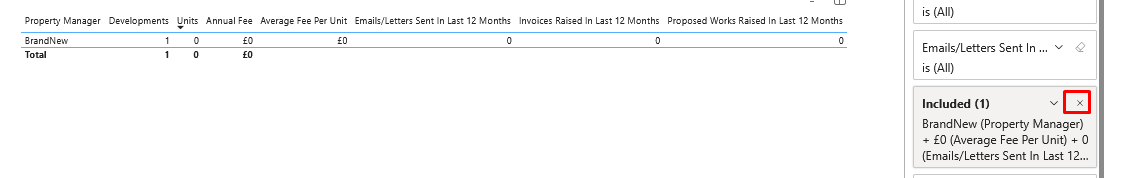
- Include: Show only this item in the report.
- Exclude: Hide this item from the report.
- Drill through: Jump to a detailed report page filtered for the selected item.
Filters applied with Include or Exclude can be removed in the Filter Pane:
- Right-clicking a row in a table provides the same options, plus a Copy option:
- Select Copy Value to only copy the value in the cell you clicked on.
- Select Copy selection to copy the whole row you clicked on.
Related Articles
Property Portal - Comments
This article is part of the Property Portal section. Find all related articles here: Property Portal Introduction You can add comments to meetings, cases, jobs and estimates — but not to tasks. There are two types of comments: public and private. Use ...Property Portal - Signing Up and the Dashboard
This article is part of the Property Portal section. Find all related articles here: Property Portal Introduction The Property Portal is a web-based application designed to help property managers and homeowners interact more easily. It allows you to ...Property Portal - Jobs and Estimates
This article is part of the Property Portal section. Find all related articles here: Property Portal Jobs You can view jobs raised for developments in the Jobs menu. All active jobs are listed with their current status. You can sort columns and use ...Property Portal - Admin: Users, User Groups and Permissions
This article is part of the Property Portal section. Find all related articles here: Property Portal In the Admin menu > Users submenu, you can: create and manage users create and manage user groups assign and unassign permissions Use the three ...Property Portal - Admin: Client Portal - How It Looks
This article is part of the Property Portal section. Find all related articles here: Connect The New Client Portal can be customised in Property Portal. You can configure the following aspects to match your organisation’s branding and settings: ...